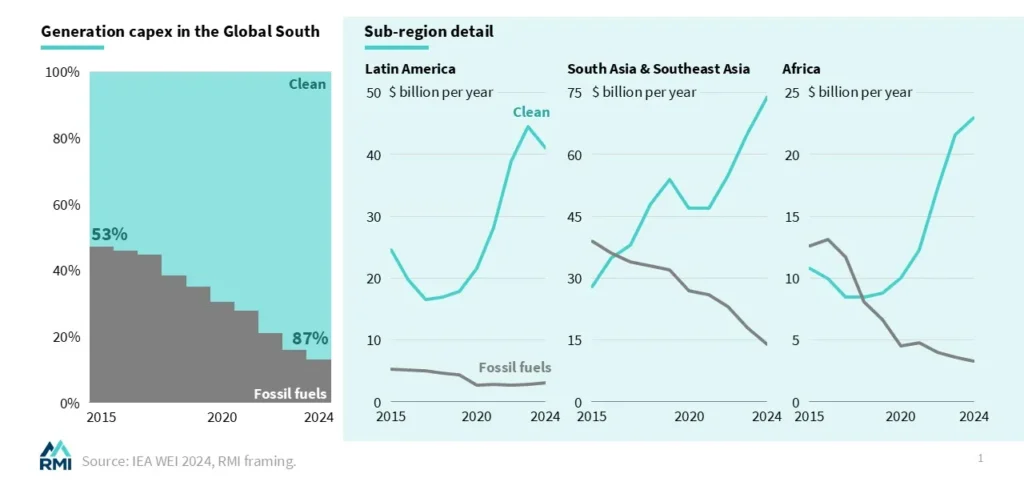
New data from the Rocky Mountain Institute found that solar and wind power is growing twice as fast in the developing world as in the global north. Check out this chart of investment in clean and dirty energy
Solar installations dramatically outstrip projections

“Solar capacity is getting installed so quickly, it is now doubling every three years — a tenfold growth in the past ten years. In that same decade, solar has gone from being one of the most expensive forms of electricity to the cheapest.” Chris Hatch, Zero Carbon newsletter. Graph above by Auke Hoekstra.
International Gallop Poll on Climate – Nature Climate Change journal

The countries included in this study account for 96% of the world’s greenhouse gas (GHG) emissions, 96% of the world’s gross domestic product (GDP) and 92% of the global population.
- 130,000 surveyed in 125 countries
- 89% of people around the world demand their governments do more to fight global heating
- In Canada that’s 82%
- 69% of people across the world are willing to contribute 1% of personal income to that task
- Almost half of Canadians are willing to donate 1% of personal income, despite having been bombarded by a massive propaganda campaign from Big Oil
Check out this nifty interactive map and this interactive graph.
Read the full survey report.
Teach About Climate Change With 30 Graphs From The New York Times
A new collection to explore our planet’s warming oceans, intensifying storms and rising air temperatures, as well as its greenhouse gas emissions and climate solutions.
More Renewables = Less Shipping, But Not For the Reason You Think

The above image is a Tweet (“X”) from @billmckibben. Here’s Bill McKibben’s Map Source, the Marine Traffic Live Map. (Fascinating! Worth clicking around.) The green arrows are cargo ships, the red are tankers. As of the evening of Nov. 2, they are live monitoring 369,000+ vessels.
Watch the planet heating from 1880-2021 in 30 seconds! (NASA mp4)

Effects of Smoke

A screenshot from the trial testimony in the Montana chilrdren’s court case Held vs. Montana. It explains pretty clearly why we musn’t be out in this smoke. Learn more about the case in Mother Jones.
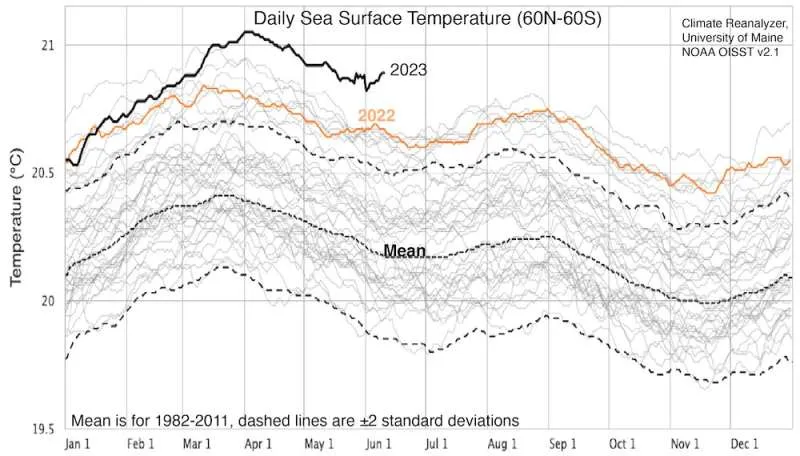
This is fast becoming one of the most iconic images in the history of the climate fight—it shows the insanely anomalous rise in sea surface temperatures so far this spring.
Nine tipping points that could be triggered by climate change.
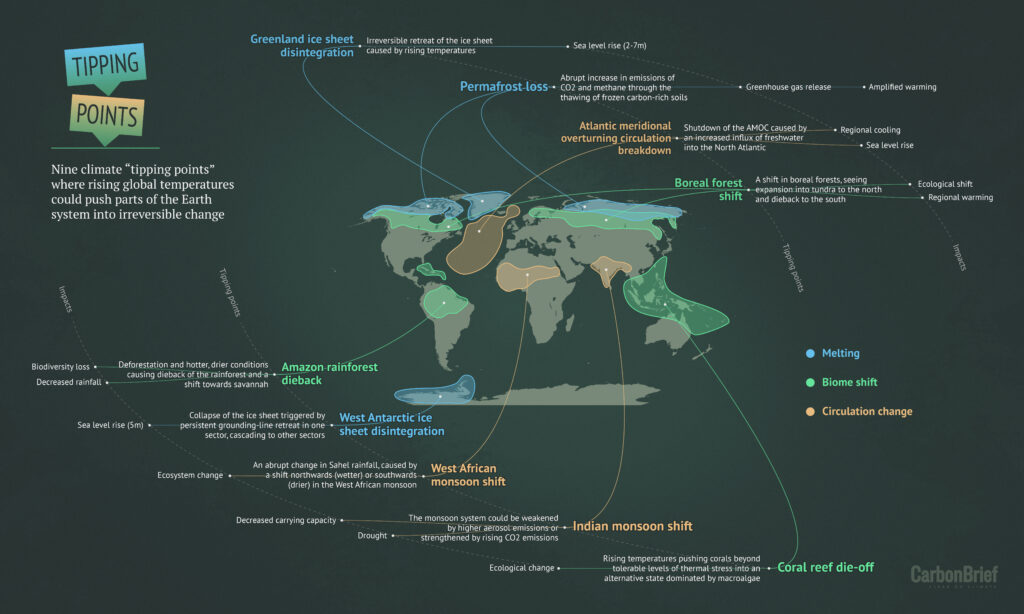
What Are Tipping Points? Explainer: https://www.carbonbrief.org/explainer-nine-tipping-points-that-could-be-triggered-by-climate-change/

From the IPCC and World Resources Institute.